What Do 100 Million Users On A Google Service Mean? – System Design for Scale and High Availability
Imagine a simple service with an API server and a database.
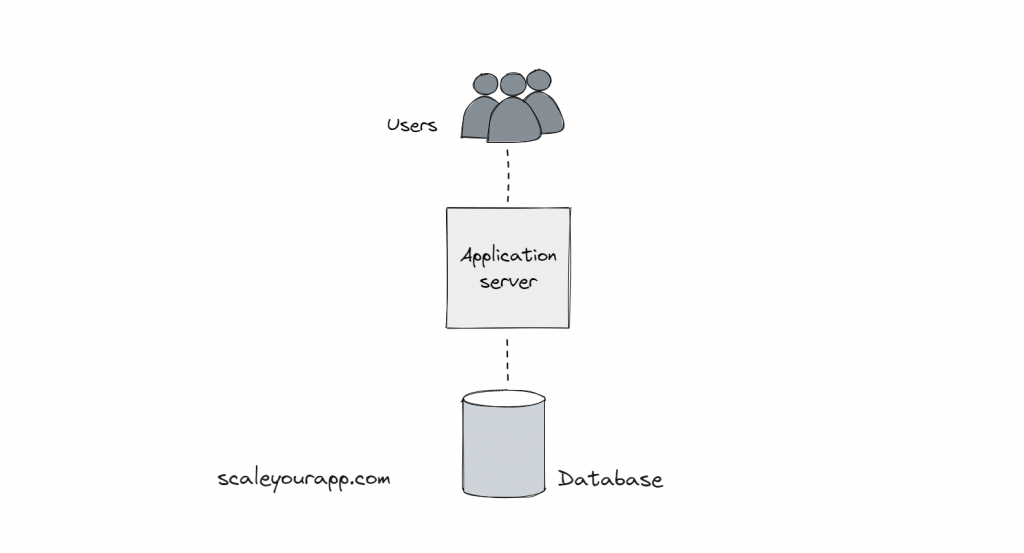
Now when this service is owned by Google, the traffic is expected to be in the scale of 100 million users. That means:
10 billion requests/day
100k requests/second (average)
200k requests/second (peak)
2 million disk seeks per second (IOPS)
How are these served?
100 million users (at peak) need 2 million IOPS (Input-output operations per second) at 100 IOPS per disk, that’s 20k disk drives at 24 disks per server, that’s 834 servers at 4 rack units (RU) per server and 1¾” (4.44cm) per RU, that’s 486 ft (148m) stacked.
To handle this scale of traffic Google deploys a lot of servers (in thousands). This setup of massive infrastructure (servers, clusters, data centers, low-latency network) is known as warehouse-scale computing. The infrastructure is managed and monitored by the SRE (Site Reliability Engineering) team at Google.
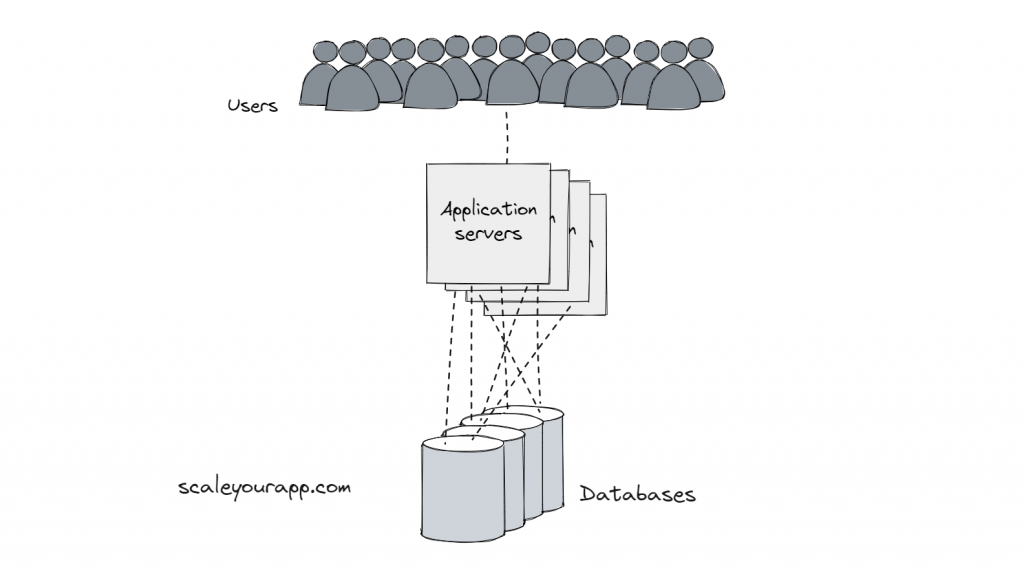
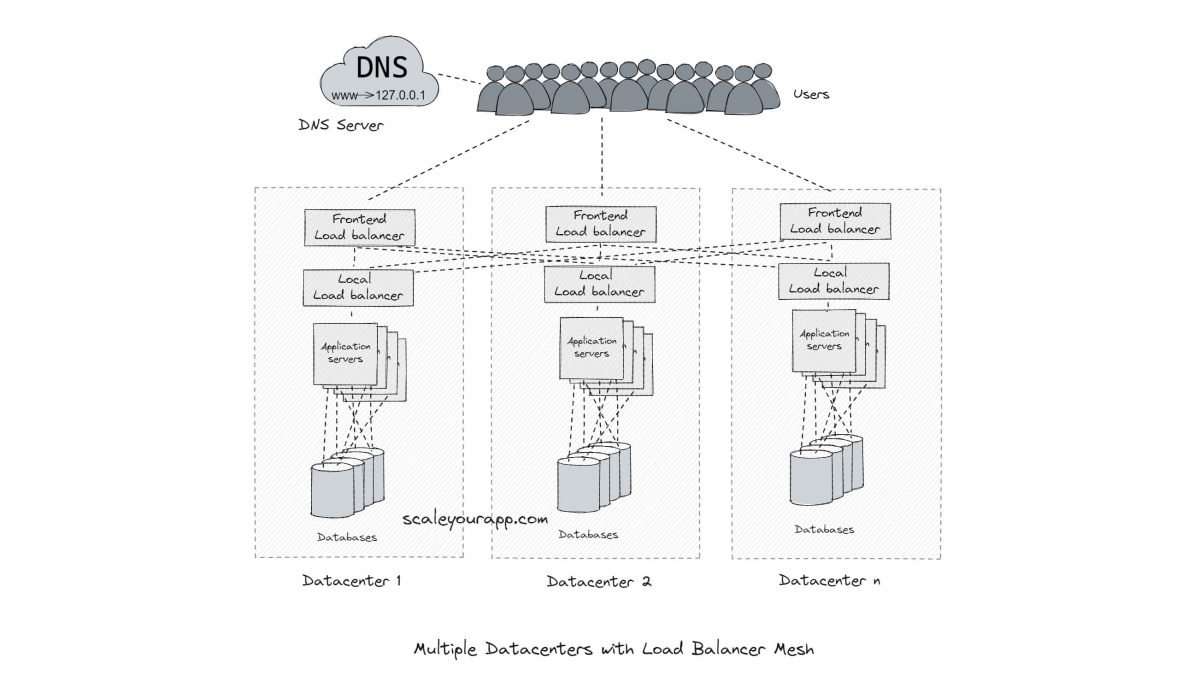
The API and the database servers are replicated, and they talk to each other via meshed topology.
Load balancing
Load balancers are set up in data centers that work with IP geo location-aware DNS servers to route requests to thousands of servers intelligently.
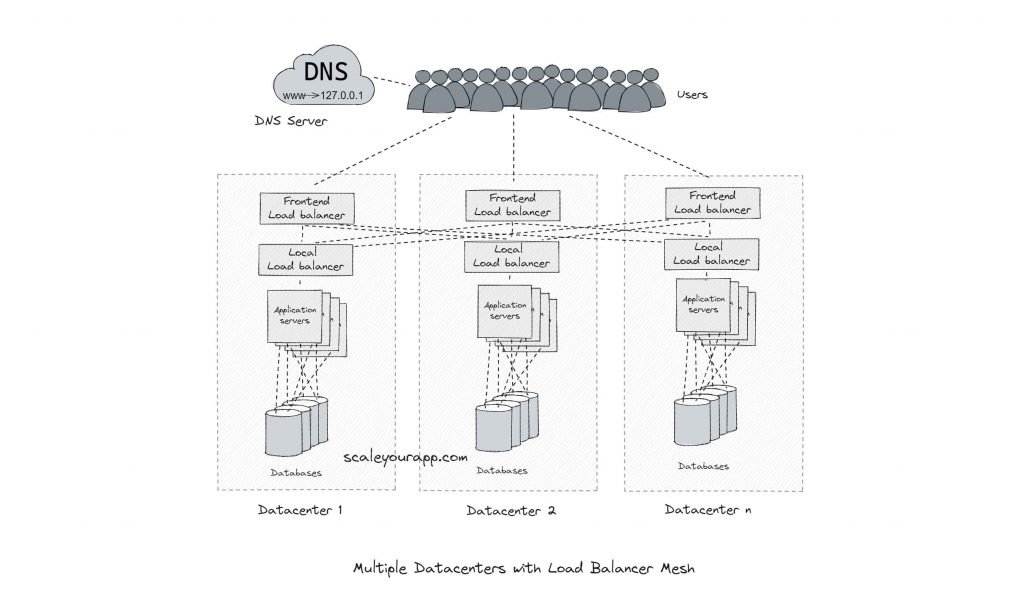
Load balancing helps decide amongst thousands of machines running across multiple data centers which machine will serve a certain request. Ideally, the traffic is distributed across the servers in an optimal fashion based on several factors such as round-trip time, latency, throughput, etc.
So, for instance, a search request is routed to the nearest data center that could offer minimum latency. On the other hand, a video upload request is routed through the network and to the data center that could offer maximum throughput.
On a local level inside a data center, requests are intelligently routed to different machines to avoid request overload on any of them. This is a very simplified picture of how load balancing works behind the scenes in a Google network.
The clients look up the IP address of the server via DNS. This is the first layer of load balancing.
If you wish to understand how DNS and load balancing work in detail along with other web architecture fundamentals. Check out my web architecture course here.
Infrastructure Monitoring
The entire infrastructure needs to be monitored to keep an eye on the end-to-end flow. This is to: ensure the service provides the expected functionality, gauge the ratio of requests handled by data centers and individual machines, and analyze the system’s behavior (How big is the database? How fast is it growing? Is the average latency slower than the last week? Etc).
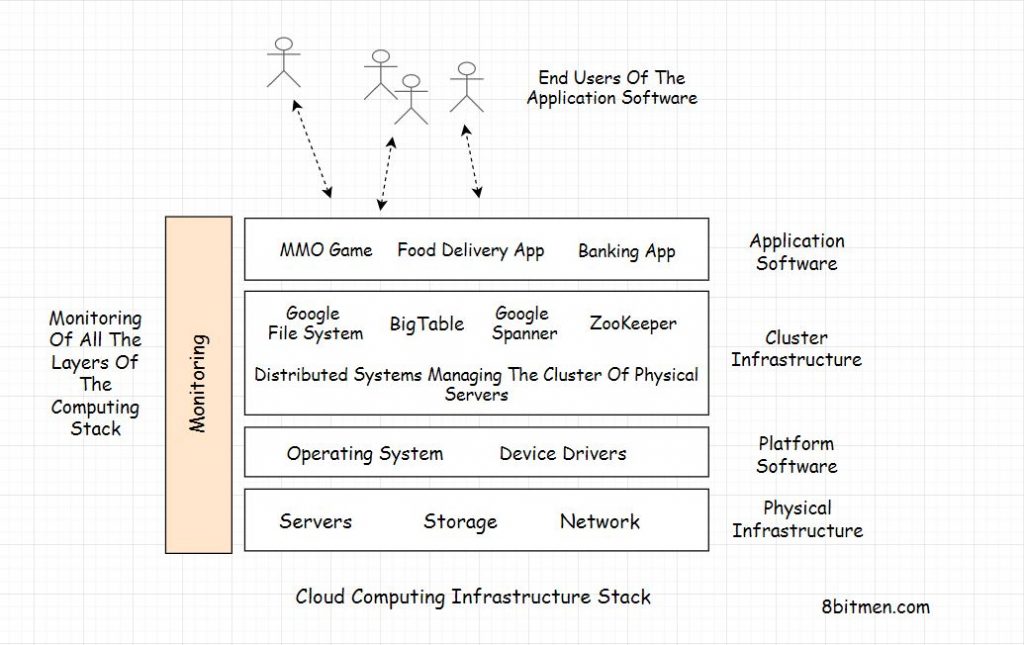
A Google SRE team comprising 10–12 members typically has one to two members whose primary task is to build and manage monitoring systems for their service.
If you wish to understand the cloud infrastructure that powers our apps globally, how clusters work, how are apps deployed globally on the cloud, deployment workflow, monitoring and more, check out my platform-agnostic cloud computing course.
SLI, SLO and SLA
Google likes to define and deliver a given level of service to the users via SLIs (Service-level Indicators), SLOs (Service-level Objectives), and SLAs (Service-level Agreements).
SLI is a quantitative measure of the level of service that is provided. For instance, request latency, error rate, throughput, availability, QPS (Queries per second), etc., are key service-level indicators. Different services focus on different SLIs. For instance, a search service would focus on latency. A cloud data upload service would focus on throughput, data integrity, durability and so on.
SLO is a target value or a range of value measured by SLI. For instance, keeping the request latency below 100 milliseconds is a service-level objective. Here 100 ms is the service-level indicator.
SLA is a contract between Google and the users which specifies what would happen when an SLO isn’t met. Though this is primarily applicable for B2B use cases. A public service like Google Search wouldn’t have SLAs.
Handling Overload
Load balancing is setup to avoid any of the machines getting overloaded. Despite an efficient load balancing in place, requests find their way to overload some parts of the system. In these scenarios, the system overload has to be gracefully handled to maintain service reliability.
One option to deal with overload is to serve degraded responses—responses with less or not so accurate data requiring less compute power. For instance, to send a response to a search query, the system would scan a small part of the dataset as opposed to searching through the entire set or it would scan the local copy of the results as opposed to searching through the latest data.
However, if the load is extreme, the service might not be even capable of sending degraded responses. In this case, errors are returned in the response.
Even in this scenario, errors are only returned to the clients sending too many requests. The other clients remain unaffected.
Per-service Quotas
Quotas are also defined per service to uniformly distribute the resources of data centers across services. For instance, if there are 10K CPU seconds per second available across multiple data centers. Gmail would be allowed to consume 4K CPU seconds per second. Calendar 4K CPU seconds per second. Android 3K CPU seconds per second and so on.
These numbers may add up to more than 10K, though it’s unlikely that all the services would hit their max. consumption simultaneously. All the global usage information is aggregated in real-time to form an effective per service limit quota.
Client-side throttling is implemented to avoid servers getting rammed with requests. If the requests are rejected for a certain client (service), the service starts self-regulating the amount of traffic it generates.
Request Criticality
Service requests are tagged with criticality labels and those with higher criticality are given a priority.
CRITICAL_PLUS requests hold the highest priority and can cause a severe impact if not served.
CRITICAL is the default label for requests with less severe impact than CRITICAL_PLUS in case of failure.
It’s okay for SHEDDABLE_PLUS requests to experience partial unavailability. These requests are primarily batch jobs that can be retried.
SHEDDABLE requests may experience full unavailability occasionally.
Cascading Failures
If a cluster goes down due to heavy traffic load, the active traffic gets routed to other clusters, further adding up to their load. This spikes their chances of going down too, unable to handle the increased load, creating a domino effect.
To avert this, the capacity of the servers is load tested along with performance testing and capacity planning to determine the load at which the servers/clusters would start going down.
For instance, if a cluster’s breaking point is 10K queries per second for a service’s peak load of 50K QPS, approx. 6 to 7 clusters are provisioned. This significantly reduces the chances of a service going down due to overload.
Data Integrity
A study at Google revealed that the most common reason for data loss is software bugs. Thus they have multiple strategies put into effect to avoid and recover from accidental loss of data.

From the diagram, in a scenario where a user deletes their data, the service enables the user to undelete it, if a delete event occurs by mistake. This protects the data being deleted by the user by mistake.
In a case where the application deletes the data, the user cannot retrieve it. Though it can be retrieved by the administrators and the support people. This protects the permanent data loss due to application bugs.
When the application permanently purges the data (maybe after a stipulated time after the user deletes it), it cannot be restored by the user, admins or the support team. In this case, the data is completely lost by the application and can only be retrieved if an external backup (usually in tapes) has been made.
Data Deletion Events @Google Due to a Bug
Gmail – Restore From GTape
On Sunday, February 27, 2011, Gmail lost quite an amount of user data despite having many safeguards, internal checks and redundancies. With the help of GTape (a global backup system for Gmail), they were able to restore 99%+ of the customer data. Taking backup on a tape also provides protection against disk failures and other wide-scale infrastructure failures.
Google Music – Restore From GTape
A privacy-protecting data deletion pipeline (designed to delete big numbers of audio tracks in record time. The privacy policy meant music files and relevant metadata gets purged within a reasonable time after users delete them) removed approximately 600,000 audio references affecting audio files for 21,000 users on Tuesday, 6th of March, 2012.
Google had audio files backed up on tape sitting in offsite storage locations. Around 5K tapes were fetched to restore the data. However, only 436,223 of the approximately 600,000 lost audio tracks were found on tape backups, which meant that about 161,000 other audio tracks were eaten by the bug before they could even be backed up.
In the initial recovery, 5475 restore jobs were triggered to restore the data from the tapes that held 1.5 petabytes of audio data. The data was scanned from the tapes and moved to the distributed compute storage.
Within a span of 7 days, 1.5 petabytes of data had been brought back to the users via offsite tape backups.
The missing 161,000 audio files were promotional tracks and their original copies luckily went unaffected by the bug. In addition, a small portion of these were uploaded by the users themselves. This concluded the complete recovery process for the event.
Source: Designing and Operating Highly Available Software Systems at Scale – Google Research Google site reliability engineering
Distributed Systems
For a complete list of similar articles on distributed systems and real-world architectures, here you go

Before You Bounce Off
Shivang
Related posts
Zero to Software Architecture Proficiency learning path - Starting from zero to designing web-scale distributed services. Check it out.
Master system design for your interviews. Check out this blog post written by me.
Zero to Software Architecture Proficiency is a learning path authored by me comprising a series of three courses for software developers, aspiring architects, product managers/owners, engineering managers, IT consultants and anyone looking to get a firm grasp on software architecture, application deployment infrastructure and distributed systems design starting right from zero. Check it out.
Recent Posts
- System Design Case Study #5: In-Memory Storage & In-Memory Databases – Storing Application Data In-Memory To Achieve Sub-Second Response Latency
- System Design Case Study #4: How WalkMe Engineering Scaled their Stateful Service Leveraging Pub-Sub Mechanism
- Why Stack Overflow Picked Svelte for their Overflow AI Feature And the Website UI
- A Discussion on Stateless & Stateful Services (Managing User State on the Backend)
- System Design Case Study #3: How Discord Scaled Their Member Update Feature Benchmarking Different Data Structures
CodeCrafters lets you build tools like Redis, Docker, Git and more from the bare bones. With their hands-on courses, you not only gain an in-depth understanding of distributed systems and advanced system design concepts but can also compare your project with the community and then finally navigate the official source code to see how it’s done.
Get 40% off with this link. (Affiliate)

Follow Me On Social Media