This article is an in-depth write-up on Grafana – An open-source tool for running analytics and monitoring our systems online. It contains answers to all our questions about it such as what is it? Why use it? Can I deploy it on-prem? How popular is it? etc.
I’ll also share a bit of my experience with the tool.
So, without further ado.
Let’s get started.
Distributed Systems
For a complete list of similar articles on distributed systems and real-world architectures, here you go
1. What is Grafana and what is it used for?
Grafana is an open-source solution for running data analytics with the help of metrics that give us an insight into the complex infrastructure and massive amount of data that our services deal with, with the help of customizable dashboards.
Grafana connects with every possible data source such as Graphite, Prometheus, Influx DB, ElasticSearch, MySQL, PostgreSQL etc. The open-source nature of the solution helps us alternatively write custom plugins to connect with any data source of our choice.
The tool helps us study, analyze and monitor data over a period of time, technically called time series analytics. It helps us track the user behavior, application behavior, frequency of errors popping up in production, pre-prod or any other environment, type of errors popping up and the contextual scenarios by providing relative data.
A big upside of the project is it can be deployed on-prem by organizations that do not want their data to be streamed over to a vendor cloud for security reasons.
Over time this framework has gained a lot of popularity in the industry and is leveraged by big guns such as PayPal, eBay, Intel and many more. I’ll discuss the industry use cases up ahead in the article.
Besides the core open-source solution, there are other two services offered by the Grafana team called the Grafana Cloud and the Enterprise. What are they? More on that up ahead in the article.
Before that, let’s dig a little deeper into the functionality and the architectural flow of the tool with an understanding of the Grafana dashboard.
2. What is the Grafana dashboard?
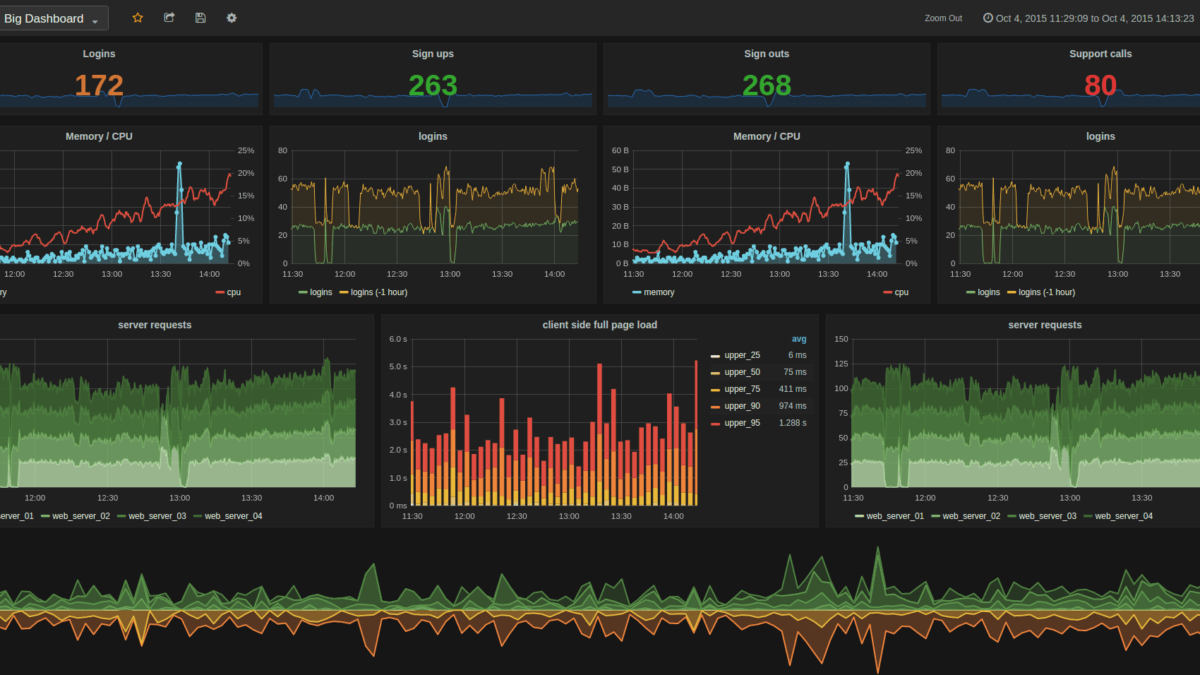
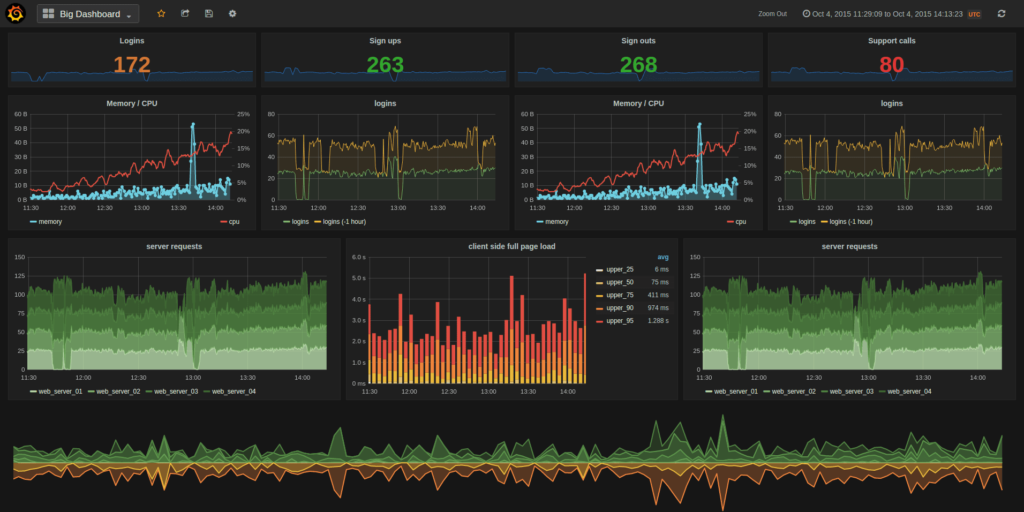
Here is a snapshot of a Grafana dashboard monitoring the infrastructure.
The dashboards pull data from plugged-in data sources such as Graphite, Prometheus, Influx DB, ElasticSearch, MySQL, PostgreSQL etc. These are a few of the many data sources that Grafana supports by default.
The dashboards contain a gamut of visualization options such as geo maps, heat maps, histograms, and a variety of charts and graphs which a business typically requires to study data.
The dashboard contains several different individual panels on the grid. Each panel has different functionalities.
2.1 My experience with Grafana
In my former project, I used Grafana for monitoring my application infrastructure. It helped me track metrics like the percentage of errors popping up, server uptime, etc.
The app instances were deployed as Docker containers managed by docker swarm. There were times when the instances were down or a critical issue caused the system to crash. All of these scenarios were tracked on the Grafana dashboard, which made my life a lot easier.
The data was pulled from Prometheus which was plugged into the Grafana dashboard as a data source. Queries were fired from the dashboard with different expressions such as min, avg etc. And Prometheus pulled data from cAdvisor. Here is the architectural flow.
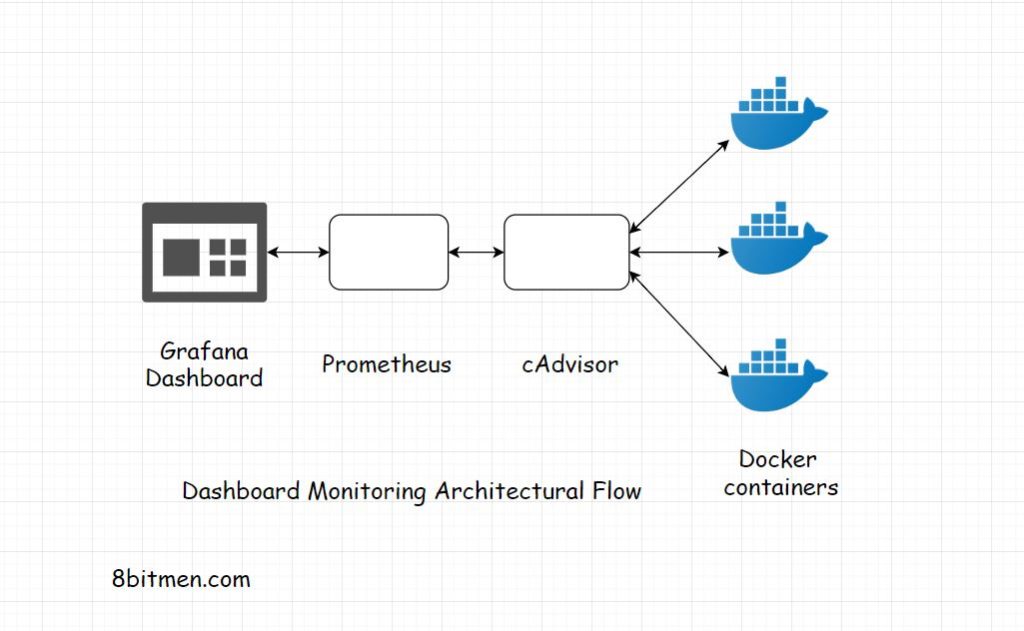
Initially, I set up the monitoring in the pre-production environment and later the tool was used to monitor events in the production environment. Several pre-meditated checks were put in place and alarms were configured when they occurred. This helped me starkly in gaining an in-depth understanding of the system’s behavior.
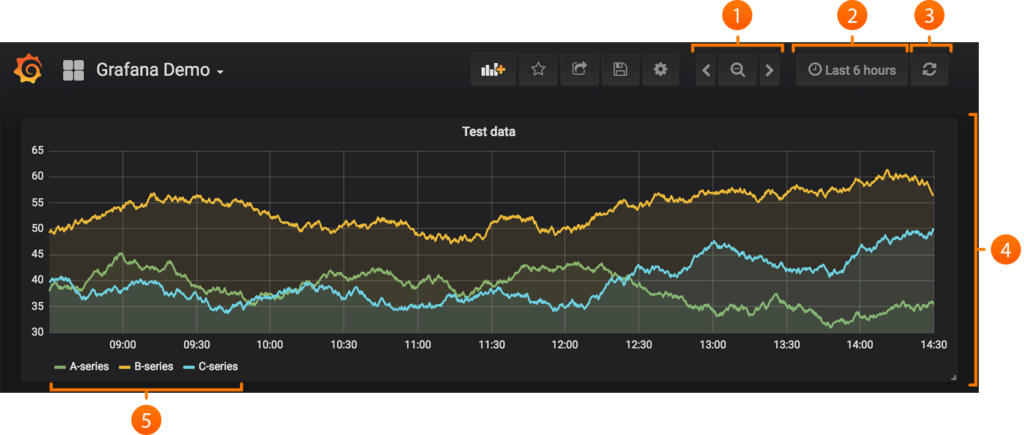
I also could use past data that I could track on the dashboard by filtering down by time range for planning out future operations. In addition to this Kibana was used for monitoring but mostly it was for log tracking.
3. What features are offered by Grafana?
Grafana takes care of all the analytics of our app. We can easily query, visualize, set up alerts, and understand the data with the help of metrics. The dashboard is pretty equipped with various features and is continually evolving which helps us make sense of complex data. From displaying graphs to heatmaps, histograms, Geo maps and so on. The tool has a plethora of visualization options to understand data as per our use case.
Alerts are set up and triggered like tripwires whenever an anticipated scenario occurs. These happenings can be notified on Slack or whichever communication tool the monitoring team uses.
Grafana has native support for approx. a dozen databases with quite a number of plugins. Either host it on-prem or on any cloud platform of your choice.
It has built-in support for Graphite and expressions like add, filter, avg, min, max functions etc. to custom fetch data. What is Graphite? I’ll come to that. It also has built-in Influx DB, Prometheus, ElasticSearch, and CloudWatch support. I’ll talk about it all up ahead.
4. What is Grafana Cloud?
Grafana Cloud is a cloud-native, highly available, performant fully managed open SaaS (Software-as-a-Service) metrics platform. Pretty helpful for those who do not want to take the load of hosting the solution on-prem and want to stay worry-free about managing the entire deployment infrastructure.
It runs on Kubernetes clusters. The backend is Prometheus and Graphite compatible. For more information navigate here.
5. What is Grafana enterprise?
The enterprise service comes with all the Grafana Cloud features plus premium plugins, data sources and premium support from the core team. We get response SLAs, training and a lot more. For more information visit.
6. What are some of the industry use cases of Grafana?
Grafana dashboards are deployed all over the industry be it gaming, IoT, Fintech or eComm space.
StackOverflow uses the tool to enable their developers and site reliability teams to create tailored dashboards to visualize data and optimize their server performance.
Digital Ocean uses Grafana to share visualization data between their teams and have in place a common visual data sharing platform.
For further reading on the industry use cases, here you go.
By now I am pretty sure you have an idea of what Grafana is and why use it.
Now let’s find out what are Graphite and Prometheus.
7. What is Prometheus Grafana?
Prometheus is an open-source data monitoring tool. The combination of Prometheus and Grafana is the de-facto combination leveraged in the industry for deploying a data visualization setup. Grafana dashboard is used for visualizing the data whereas the backend is powered by Prometheus.
Though Prometheus too has data visualization features still, Grafana is preferred for visualizing data. Queries are fired from the Grafana dashboard and the data is fetched from Prometheus.
It acts as a perfect open-source data model for storing time series data.
8. What is Graphite Grafana?
Graphite, again, is a monitoring tool. It facilitates the storage and visualization of time series data. Ideally, Graphite is used as a data source for the Grafana dashboard in a data monitoring setup.
Grafana has a pretty advanced Graphite query editor which enables us to interact with the data with the help of expressions and functions.
9. Grafana vs Kibana?
As I stated earlier. In my former project, Kibana was primarily used for analyzing and monitoring logs. Kibana is the K in the ELK stack. The whole intention of writing Kibana by the ElasticSearch team was to have an efficient tool to monitor logs. Just click around and track the context of exceptions occurring in prod instead of running Linux commands in the console to find them.
On the other hand, Grafana is written as a generic monitoring solution for running monitoring and analytics on pretty much anything. This is a very bird’s eye view of the difference between both tools.
Read this if you wish to get a deeper insight.
If you wish to get an in-depth insight into the application deployment infrastructure that includes topics like application deployment workflow, clustering, cloud storage, how services are deployed on the cloud globally across different cloud regions and availability zones, different cloud deployment and service models, check out my platform agnostic cloud computing course.
If you found the content helpful, I run a newsletter called Backend Insights, where I actively publish exclusive posts in the backend engineering space encompassing topics like distributed systems, cloud, application development, shiny new products, tech trends, learning resources, and essentially everything that is part of the backend engineering realm.
Being a part of this newsletter, you’ll stay on top of the developments that happen in this space on an ongoing basis in addition to becoming a more informed backend engineer. Do check it out.
Shivang
Related posts
Zero to Software Architecture Proficiency learning path - Starting from zero to designing web-scale distributed services. Check it out.
Master system design for your interviews. Check out this blog post written by me.
Zero to Software Architecture Proficiency is a learning path authored by me comprising a series of three courses for software developers, aspiring architects, product managers/owners, engineering managers, IT consultants and anyone looking to get a firm grasp on software architecture, application deployment infrastructure and distributed systems design starting right from zero. Check it out.
Recent Posts
- System Design Case Study #5: In-Memory Storage & In-Memory Databases – Storing Application Data In-Memory To Achieve Sub-Second Response Latency
- System Design Case Study #4: How WalkMe Engineering Scaled their Stateful Service Leveraging Pub-Sub Mechanism
- Why Stack Overflow Picked Svelte for their Overflow AI Feature And the Website UI
- A Discussion on Stateless & Stateful Services (Managing User State on the Backend)
- System Design Case Study #3: How Discord Scaled Their Member Update Feature Benchmarking Different Data Structures
CodeCrafters lets you build tools like Redis, Docker, Git and more from the bare bones. With their hands-on courses, you not only gain an in-depth understanding of distributed systems and advanced system design concepts but can also compare your project with the community and then finally navigate the official source code to see how it’s done.
Get 40% off with this link. (Affiliate)

Follow Me On Social Media