Distributed Systems and Scalability Feed #1 – Heroku Client Rate Throttling, Tail Latency and more
What does 100 million users on a Google service mean?
10 billion requests/day
100k requests/second (average)
200k requests/second (peak)
2 million disk seeks per second (IOPS)
How are these served?
100 million users need (at peak) 2 million IOPS at 100 IOPS per disk, that’s 20k disk drives at 24 disks per server, that’s 834 servers
at 4 rack units (RU) per server and 1¾” (4.44cm) per RU, that’s
486 ft (148m) stacked.
$64,944 spent on AWS, to support 25,000 customers, in August by ConvertKit
ConvertKit provides a full breakdown of their AWS bill.
Here is a high level breakdown:
- EC2-Instances – $19,525.87
- Relational Database Service – $19,020.12
- S3 – $11,107.75
- EC2-Other – $5,026.44
- Support – $4,378.71
- Others – $5,885.88
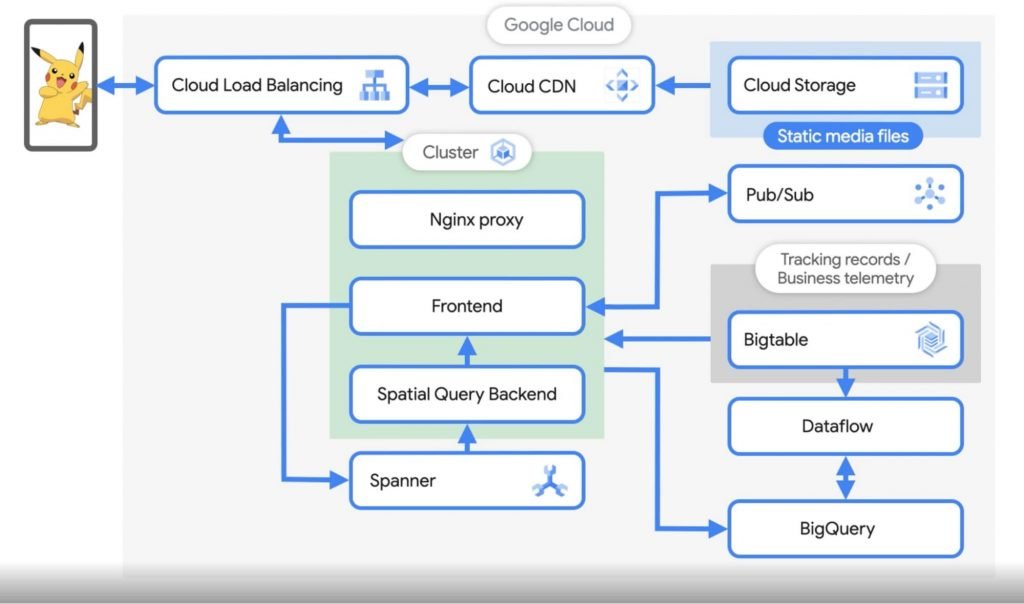
How Pokemon Go scales to millions of requests per second?
During major Pokemon events, the requests on the game spike from 400K per second to close to a million in a matter of minutes.
The primary Google cloud services powering the game are GKE Google Kubernetes Engine and Cloud Spanner. At any given time, approx. 5K Spanner nodes are active handling the traffic.
The platform is powered by several microservices powered by GKE. The team initially started with Google Datastore (NoSQL) and later transitioned to Spanner, a relational database product of GCP, as they needed more control over the size and the scale of the database.
With the consistent indexing and strong consistency that Spanner provided, they could work with more complex database schemas with primary and secondary keys.
Approx. 5 to 10TB of data gets generated per day, which is stored in BigTable and BigQuery. This data helps with the player behavior analysis, marketing, improving the algorithms, etc. Read more here.
How Grab built a scalable, high-performance ad server
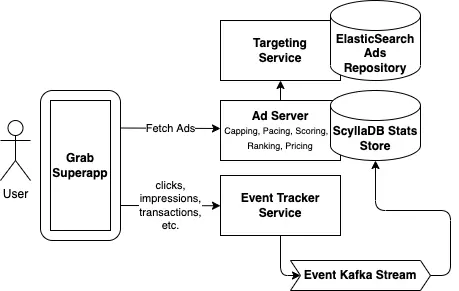
During the pandemic, as the demand for food delivery spiked, Grab launched their ad server, comprising several microservices, streams and pipelines, to help small restaurant merchant partners to expand their reach.
Latency was crucial for the product since the ads had to be loaded before the user scrolled down or bounced off. A significant effort was made fine-tuning Elasticsearch to return the contextual ads in the shortest time. Read on.
Do I need Observability if I have a simple architecture or my stack is boring?
Understandably, the need for Observability came out of microservices and cloud-native architecture, given their complexity (microservices, cloud-native, polyglot persistence, third-party services, serverless APIs, messaging infrastructure, and more, all in conjunction) and the variety of technologies being leveraged.
But what about simple use cases? For instance, monoliths.
Even with simple use cases, Observability helps a great deal. For instance, tracing if a certain request in the system triggers hundreds of DB queries sequentially or fires off all of them at once, overwhelming the database when we thought the request triggered only a single query in the system.
Understanding the data flow in the monolith app right from the point the API request is received to the point it hits the database. This also helps trace out the bottlenecks, resource-hungry processes, etc.
To use or not to use Observability in simple systems largely depends on how often do we feel the need to understand the inner workings of our system end to end. How often something unexpected occurs and how long does it take to resolve that etc. Read more here.
How Reliability and Product Teams Collaborate at Booking.com
Booking.com has a solid infrastructure with a footprint of 50,000+ physical servers running across four data centers and six additional points of presence that’s constantly monitored.
Given the size of the infrastructure, it’s viable to have dedicated teams to ensure the reliability of the server fleet.
This write-up on Medium.com delineates how reliability and product teams at Booking.com collaborate leveraging the RCM (Reliability Collaboration Model) and the Ownership map.
The RCM creates visibility for all the tasks (Basic Ops, Disaster recovery, Observability, Advanced Ops) that are required to maintain the quality of a service and the support levels. The ownership map makes the product and the reliability teams (with a different understanding of what infrastructure and reliability meant and varying expectations as to what reliability teams would do for them) aware of their ownership.
Tail latency in distributed systems
Tail latency is that tiny percentage of responses from a system that are the slowest in comparison to most of the responses. They are often called as the 98th or 99th percentile response times. This may seem insignificant at first but for large applications like LinkedIn, this has noticeable effects. This could mean that for a page having a million views per day 10,000 of those page views would experience the delay. Read how LinkedIn deals with longtail network latencies.
There can be multiple causes of tail latency: increasing load on the system, complex and distributed systems, application bottlenecks, slow network, slow disk access and more. Read more on it.
RobinHood: Tail latency-aware caching
RobinHood is a research caching system for application servers in large distributed systems having diverse backends. The cache system dynamically partitions the cache space between different backend services and continuously optimizes the partition sizes.
Microsoft research has a talk on getting rid of long-tail latencies.
Heroku – Adding Client Rate Throttling to the Platform API
Heroku engineering in their blog post shared an insight into how they’ve implemented rate-throttling on their client. In computing throttling means having control over the rate of events occurring in a system; this is important to avoid the servers from being overwhelmed when subjected to a traffic load beyond their processing capacity.
Rate-limiting is a similar technique implemented on the backend of the system & as the name implies it puts a limit on the rate of requests the API servers process within a stipulated time to ensure the service uptime.
If a certain client sends too many requests, it starts receiving an error in the response due to rate-limiting implemented on the server. But just limiting the rate at which the API processes the client requests doesn’t make the system entirely efficient.
Implementing rate-limiting on the backend doesn’t stop the clients from sending the requests. In this scenario, the bandwidth is continually consumed as well as the rate-limiting logic continually has to run on the backend thus consuming additional compute resources.
We need to implement rate-throttling on the client to enable it to reduce the rate at which it sends the requests to the backend as & when it starts receiving the error.
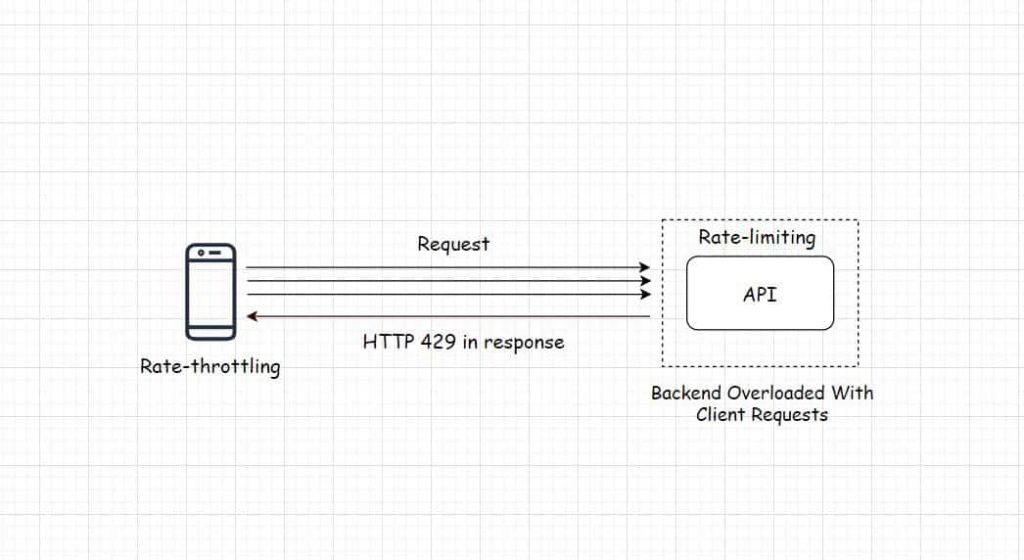
Rate-throttling & rate-limiting implemented together make an efficient API. Another way to deal with the deluge of clients requests is to implement Webhooks. If you need to understand Webhooks & wish to gain a comprehensive insight into the fundamentals of web application & software architecture you can check out my Web Application & Software Architecture 101 course here.
There are several reasons that necessitate the need for throttling & limiting requests to the API:
- The resources are finite, there is a limit to the processing power and the bandwidth capacity of the service. If the client keeps sending the requests, the rate-limiting logic has to run on the backend continually thus consuming resources.
- Rate-limiting adds a layer of security to the service to avert it from being bombarded by bot requests, web-scraping & DDoS attacks.
- Several SaaS Software as a Service businesses have their pricing plans based on the number of requests the client makes within a stipulated time. This makes rate-limiting vital for them.
So, this was a rudimentary introduction to rate-throttling & rate-limiting; If you need to further understand the strategies & techniques, this Google Cloud resource is a good read on it. Now let’s talk about how Heroku implemented it.
Implementation
The Heroku API uses the Genetic Cell Rate Algorithm, a rate-limiting strategy on its API. The service returns an HTTP 429 response if the client requests hit the rate limit.
From the Mozilla developer doc
HTTP 429
The HTTP 429 Too Many Requests response status code indicates the user has sent too many requests in a given amount of time (“rate limiting”).
A Retry-After header might be included to this response indicating how long to wait before making a new request.
They needed an efficient rate-throttling logic on their client to tackle the HTTP 429 error; retrying every time a request failed would certainly have DDoSed the API.
They started with different tests to write an efficient rate-throttling strategy, but checking the effectiveness of different strategies was far from being simple. That made them write a simulator in addition to their tests. The simulator would simulate the API behaviour, that enabled them to come up with a satisfactory throttling strategy.
Now the next step was to integrate that strategy with the application code and deploy the updates into production, but the algorithm they came up with wasn’t that maintainable. It would have been hard for a new resource to tweak things if the creator of the algorithm wasn’t around.
If you wish to understand the code deployment workflow, application monitoring, how nodes work together in a cluster, how cloud deploys our service across the globe & more, you can check out my platform-agnostic cloud computing fundamentals course here.
Quoting the programmer who wrote the algorithm “I could explain the approach I had taken to build an algorithm, but I had no way to quantify the “goodness” of my algorithm. That’s when I decided to throw it all away and start from first principles.”
The new quantifying goals of the rate-throttling algorithm were:
- Minimum average retry rate: this meant having a retry rate with minimum HTTP 429 response from the server. This would also cut down the unnecessary bandwidth consumption, also the backend would consume less resources running the rate-limiting logic.
-
Minimum maximum sleep time: this meant minimizing the wait time of the client before it retries the request, no consumer of the service should wait for longer than what is absolutely necessary.
At the same time, the system should ensure that throttling the requests doesn’t leave the API under-consumed; If the API can handle 500K requests a day, the clients should be capable of consuming that quota every single day. - Minimize variance of request count between clients: Every client should be treated as the same by the server, there should be no exceptions.
- Minimize time to clear a large request capacity: As the state of the system changes, the clients should adapt. If the new load is introduced to the backend with the introduction of new clients the rate-throttling algorithm of all the clients should adapt.
Finally, the Heroku team ended up using the exponential backoff algorithm to implement the rate throttling on their clients.
As per Google Cloud the exponential backoff is a standard error-handling approach for network applications. As per AWS, this not only increases the reliability of the application but also reduces the operational costs for the developer.
If you wish to delve into details here is the Heroku post link.
If you want to have a look at the code here you go
Recommended reads:
Designing scalable rate-limiting algorithms
Building a distributed rate limiter that scales horizontally
Short-Term & Long-Term Solutions When Your Service Fails To Scale
Here is an interesting post by the 8th Light tech team listing out the short-term & the long-term solutions when our service is hit by unexpected traffic and sadly fails to scale. It might be the database or the application server that is on fire or maybe the disk that has maxed out as a result of the data deluge. How do we respond to such a situation? Have a read.
If you like the content consider subscribing to my newsletter to stay notified of the new content published on the blog.

Shivang
Related posts
Zero to Software Architecture Proficiency learning path - Starting from zero to designing web-scale distributed services. Check it out.
Master system design for your interviews. Check out this blog post written by me.
Zero to Software Architecture Proficiency is a learning path authored by me comprising a series of three courses for software developers, aspiring architects, product managers/owners, engineering managers, IT consultants and anyone looking to get a firm grasp on software architecture, application deployment infrastructure and distributed systems design starting right from zero. Check it out.
Recent Posts
- System Design Case Study #5: In-Memory Storage & In-Memory Databases – Storing Application Data In-Memory To Achieve Sub-Second Response Latency
- System Design Case Study #4: How WalkMe Engineering Scaled their Stateful Service Leveraging Pub-Sub Mechanism
- Why Stack Overflow Picked Svelte for their Overflow AI Feature And the Website UI
- A Discussion on Stateless & Stateful Services (Managing User State on the Backend)
- System Design Case Study #3: How Discord Scaled Their Member Update Feature Benchmarking Different Data Structures
CodeCrafters lets you build tools like Redis, Docker, Git and more from the bare bones. With their hands-on courses, you not only gain an in-depth understanding of distributed systems and advanced system design concepts but can also compare your project with the community and then finally navigate the official source code to see how it’s done.
Get 40% off with this link. (Affiliate)

Follow Me On Social Media