This article is an insight into cAdvisor – an open-source tool for running performance analysis and collecting usage data from the containers. In addition to discussing its features, I’ll also share a bit of my industry experience with the tool.
So, without further ado.
Let’s get started.
1. What is cAdvisor?
cAdvisor stands for container advisor. As evident from the name, it provides resource usage, performance characteristics and related information about the containers running on the cloud. It’s an open-source tool and runs as a daemon process in the background collecting, processing and aggregating useful DevOps information.
The tool has native support for Docker and facilitates tracking historical resource usage with histograms and other charts. This helps in understanding the resource consumption and memory footprint of the code running on the servers.
The information extracted with the help of the tool helps us figure and weed out the performance bottlenecks if any and track the memory hungry processes making accurate decisions with respect to our system’s scalability.
The official cAdvisor releases are built on Linux with a small image size.
In Kubernetes, cAdvisor is integrated into the Kubelet binary. It is pretty intelligent to auto-discover all the containers running in the machine, collects CPU, memory, file system and network usage statistics and provides a comprehensive overall machine usage by analyzing the root container.
1.1 Accessing the Container Data Collected by cAdvisor
The data collected by cAdvisor can be viewed with the help of a web-based UI which it exposes at its port or via a REST API.
The container information that is obtained is typically the container name, the list of sub-containers, container-spec, detailed usage statistics of the container for the last n seconds, a histogram of resource usage, etc.
The machine information that is returned is the number of schedulable logical core CPUs, memory capacity in bytes, the maximum supported CPU frequency, available file systems, network devices, the machine topology (nodes, cores, threads), etc.
1.1 My Industry Experience With cAdvisor
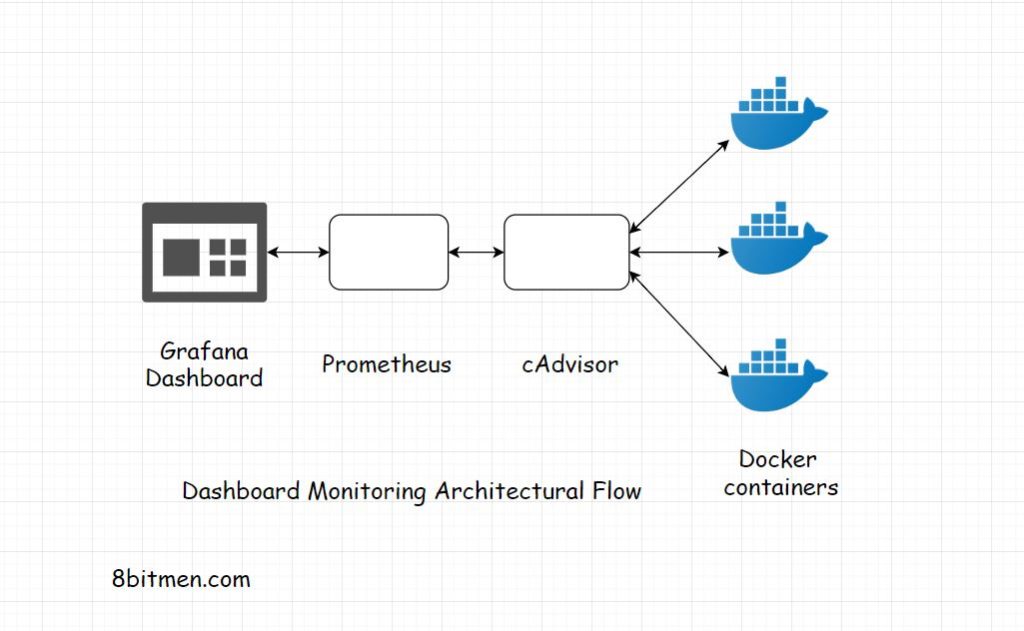
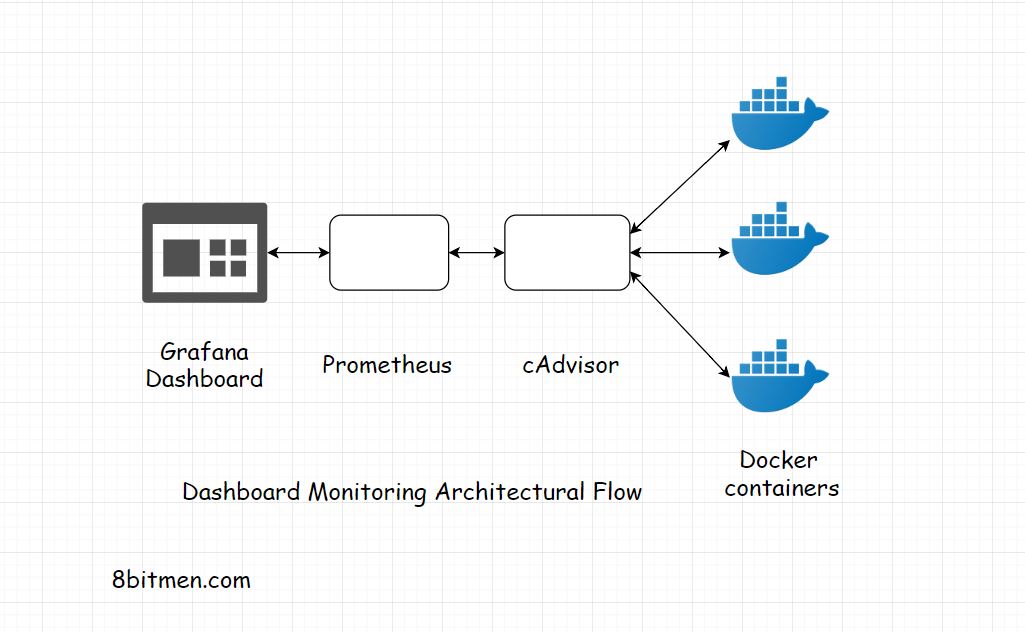
In the recent past, I worked on a massive eComm. project where we used Grafana, Prometheus & cAdvisor to set up a dashboard monitoring system. The dashboards were used to study the server instances, their uptime, exceptions, errors and contextual scenarios etc.
All the data was displayed on custom Grafana dashboards, queries were fired from these dashboard that hit Prometheus, which was plugged in into Grafana as a data source.
Container information was streamed into Prometheus from cAdvisor.
The below diagram shows the data flow between these open source tools. It’s a Grafana, Prometheus, cAdvisor-based dashboard monitoring architectural flow. For more information on how Grafana was deployed, check out this article on the blog.

2. How to Run cAdvisor With Docker?
If you intend to run the tool in a Docker container, there is an image already available that includes everything required to run it. A single cAdvisor instance can be run to monitor the whole machine. It can also be run with Canary – here are the details.
The tool is a static Go binary with no external dependencies. We can also run it standalone if we wish to. The runtime behavior can be controlled via a series of flags.
cAdvisor also performs some housekeeping periodically. With these flags, we can control how and when the tool performs the task.
3. Running cAdvisor With Prometheus
cAdvisor is largely used with Prometheus in the industry. And Prometheus is largely used with Grafana. That is kinda the de facto combination of setting up analytics and monitoring in the system.
cAdvisor exposes container statistics as Prometheus metrics intrinsically. Jobs are configured in Prometheus to connect with cAdvisor.
The tool’s web-based UI is pretty equipped to explore different kinds of stats. With it, Prometheus expression browser is often used to get a more comprehensive view of things.
4. Running cAdvisor with Kubernetes
In a Kubernetes cluster, the application can be examined at several different levels that are containers, pods, individual services or the entire cluster.
Kubernetes uses a tech called Heapster that acts as a base monitoring platform collecting cluster-wide monitoring and event data. Heapster runs in Kubernetes pods pulling data from Kubelets.
A Kubelet manages things on the cluster like managing the pods and containers on a machine. It is responsible for fetching individual container usage statistics from cAdvisor. The collected data is exposed via REST API.
The entire data is saved in a data store such as InfluxDB and streamed to Grafana for visualization.
Mastering the Fundamentals of the Cloud
If you wish to master the fundamentals of cloud computing. Check out my platform-agnostic Cloud Computing 101 course. It is part of the Zero to Mastering Software Architecture learning track, a series of three courses I have written intending to educate you, step by step, on the domain of software architecture and distributed system design. The learning track takes you right from having no knowledge in it to making you a pro in designing large-scale distributed systems like YouTube, Netflix, Hotstar, and more.
Well, folks. This is it. If you found the content helpful, do share it with your network for more reach. I’ll see you in the next article. Until then. Cheers.

Shivang
Related posts
Zero to Software Architecture Proficiency learning path - Starting from zero to designing web-scale distributed services. Check it out.
Master system design for your interviews. Check out this blog post written by me.
Zero to Software Architecture Proficiency is a learning path authored by me comprising a series of three courses for software developers, aspiring architects, product managers/owners, engineering managers, IT consultants and anyone looking to get a firm grasp on software architecture, application deployment infrastructure and distributed systems design starting right from zero. Check it out.
Recent Posts
- System Design Case Study #5: In-Memory Storage & In-Memory Databases – Storing Application Data In-Memory To Achieve Sub-Second Response Latency
- System Design Case Study #4: How WalkMe Engineering Scaled their Stateful Service Leveraging Pub-Sub Mechanism
- Why Stack Overflow Picked Svelte for their Overflow AI Feature And the Website UI
- A Discussion on Stateless & Stateful Services (Managing User State on the Backend)
- System Design Case Study #3: How Discord Scaled Their Member Update Feature Benchmarking Different Data Structures
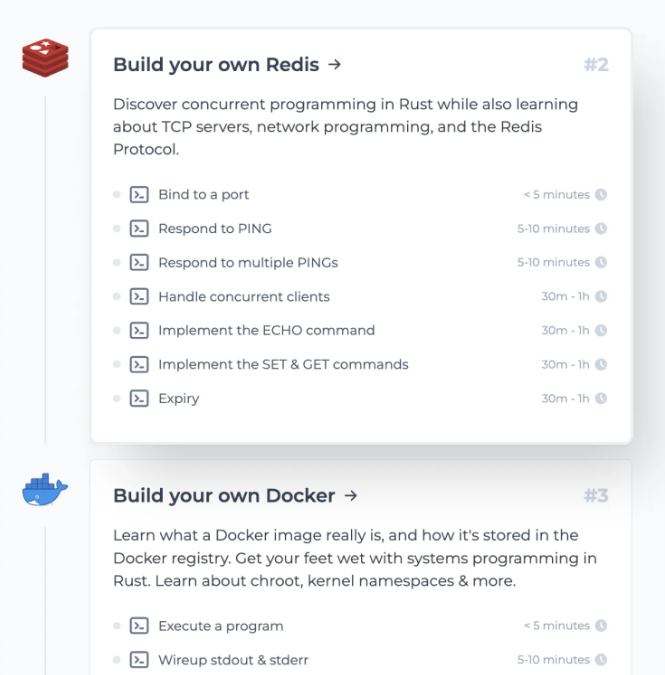
CodeCrafters lets you build tools like Redis, Docker, Git and more from the bare bones. With their hands-on courses, you not only gain an in-depth understanding of distributed systems and advanced system design concepts but can also compare your project with the community and then finally navigate the official source code to see how it’s done.
Get 40% off with this link. (Affiliate)


Follow Me On Social Media